When users bring more users


Written by: Louise Kelly
People leader, research, experience & design

Written by: Louise Kelly
People leader, research, experience & design
Increasingly, when people engage with our brand or service, they are doing so through digital interactions.
While our relationship with these people may be as customers, stakeholder, consumers or employees, when we invite them to interact with us through a digital interface, they also become our users.
When people become our users, a whole new set of needs arise alongside a new wave of opportunities. One of the most rewarding of these opportunities, is virality, when users bring more users.
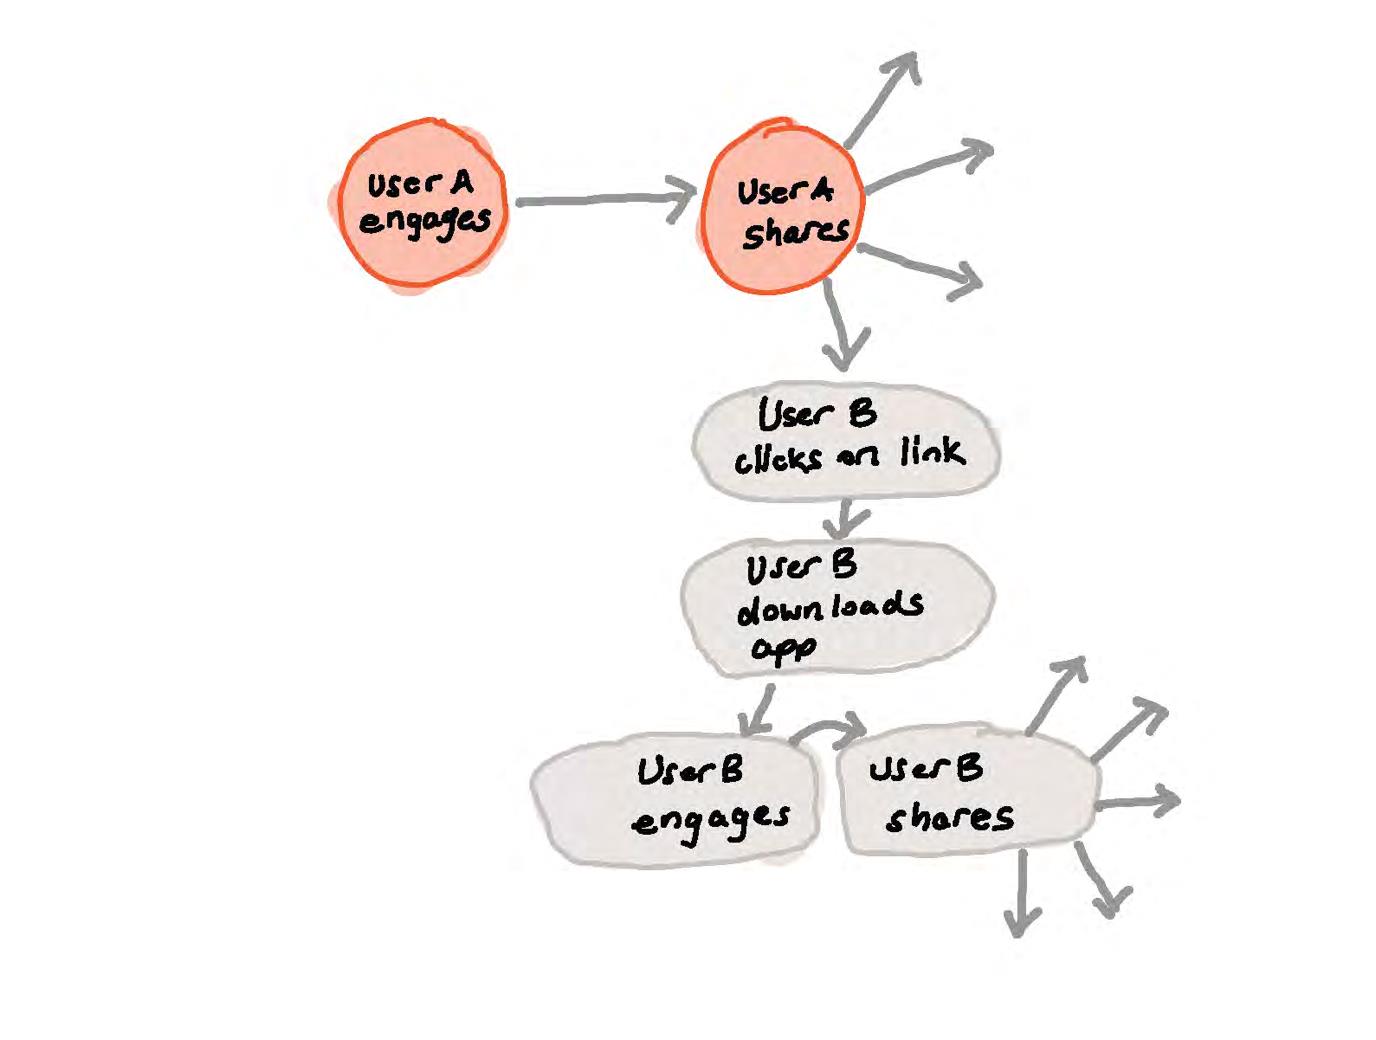
Virality is a new category of growth generated when user behaviour engages new users. It is distinct from advocacy, when a user speaks in favour of a product or influence which drives the adoption of the product. Traditional marketing and advertising alone do not generate virality, it is designed in at level of interaction or product itself. Virality works best when it is supported by advocacy and influence.
As digital interactions are set to explode, so will the opportunities for virality. The digital transformation of services, the proliferation of the internet of things, the personalisation of services and the falling cost of application development, API’s, platforms and collaborative tools, have all massively increased the touchpoints at which digital interactions happen.
The Measure of Virality
Virality is measured by a viral co-efficient known as the K factor, the rate in which users will bring other users. Mobile apps, webapps, SAAS, social media, platforms and Internet of Things devices, are all agents of virality.
The K factor is used as a measure of users, inviting other users to interact with your product. It is also a measure for customer referral programs. K factor is a lead indicator of growth. It is distinct from the net promoter score NPS, which tracks the satisfied customers who are likely to recommend the product or service, K factor tracks outcomes not intent.
What is a good K factor?
Any viral co-efficient needs to be evaluated in context of the sector, the product or service it competes in. Games, social and collaborative applications have the highest viral co-efficient.
Certain products and interactions lend themselves to virality; financial incentives, collaboration, games and social media are among the most likely to go viral.
A K factor of 1, means every user is successfully inviting one other user to join the app. A K factor of 0.2 means 1 in 5 customers are successfully inviting one other user, a strong result for some products. Viral loops, a leading blog on virality state;
“a sustainable viral factor of 0.15 to 0.25 is good, 0.4 is great, and 0.7 is outstanding.”
While K factors are typically not calculated, or tightly guarded secret, Facebook and Slack have published the K factor of their peak performing years.
Facebook’s K Factor
In Facebooks boom days they had a K factor of 7. Facebook was early to realise a single-minded focus on viral loops was critical to their growth;
“After all the testing, all the iterating, all of this stuff, you know what the single biggest thing we realized? Get any individual to seven friends in 10 days.”
Facebook’s viral growth has since lost momentum as the product as lost its appeal;
“some 44% of users between the ages of 18 and 29 deleted the Facebook app from their phone in the wake of the Cambridge Analytica scandal, according to a 2018 survey by Pew Research Center.”
Slack’s K factor
Slack’s viral co-efficient has reached 8.5 at their peak. Slack’s high virality came from their focus on marketing to ‘teams at a time’. Slack knew successful team adoption was critical to viral growth. Slack understood, that if a team hit 2,000 messages ie; 10 hours of messages from a team of 50, they would adopt the product long term.
The viral S-curve
Most viral apps, using viral marketing techniques, go up and down a S-curve of growth, rapid upwards spikes, followed by sharp declines. The S-curve of accelerated growth is typically associated with apps that use contact address book imports like Whatsapp in conjunction with viral loops. The decline reflects the high rate of churn of users who failed to engage after the initial invite.
The Viral cycle
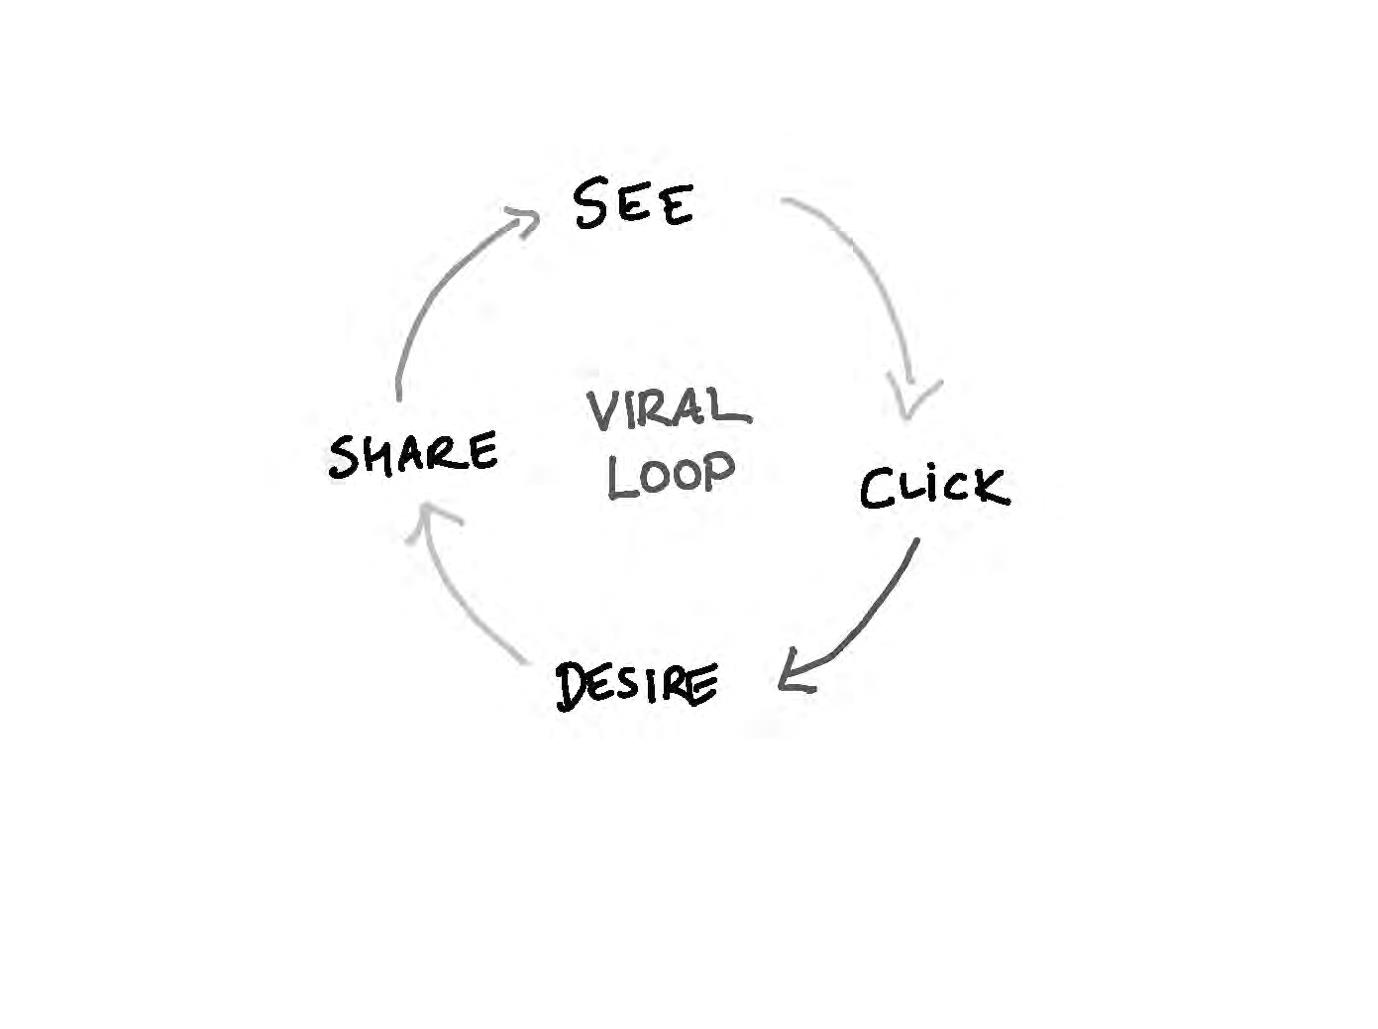
Another key metric of virality is the viral cycle time, a measure of the time span for a first time user to log into the app, complete a session, and then invite friends, who become users. The objective is to shorten this viral cycle time to speed up the rate of growth.
Viral cycles can be reduced by a number of tactics which include;
- Personalise and reduce friction of the onboarding
- Fast track onboarding with user explainer videos and instructional tips
- Adding messaging tools such as WhatsApp, to promote the loop
- Reduce friction in the sharing process with smart links (content bundled into trackable links) or deep links (links into specific features of the app)
- Build in shareable content and features into the app
- Taking the friction out of sharing
Explosive viral growth
Explosive viral growth is rare, but it does happen when a great product is promoted at the right time. Hotmail was one of the first to market with a true viral loop, quickly imitated by others including most of the tech giants, Paypal, gmail, spotify, Airbnb, amazon, Uber and DropBox.
Hotmail’s viral loop case
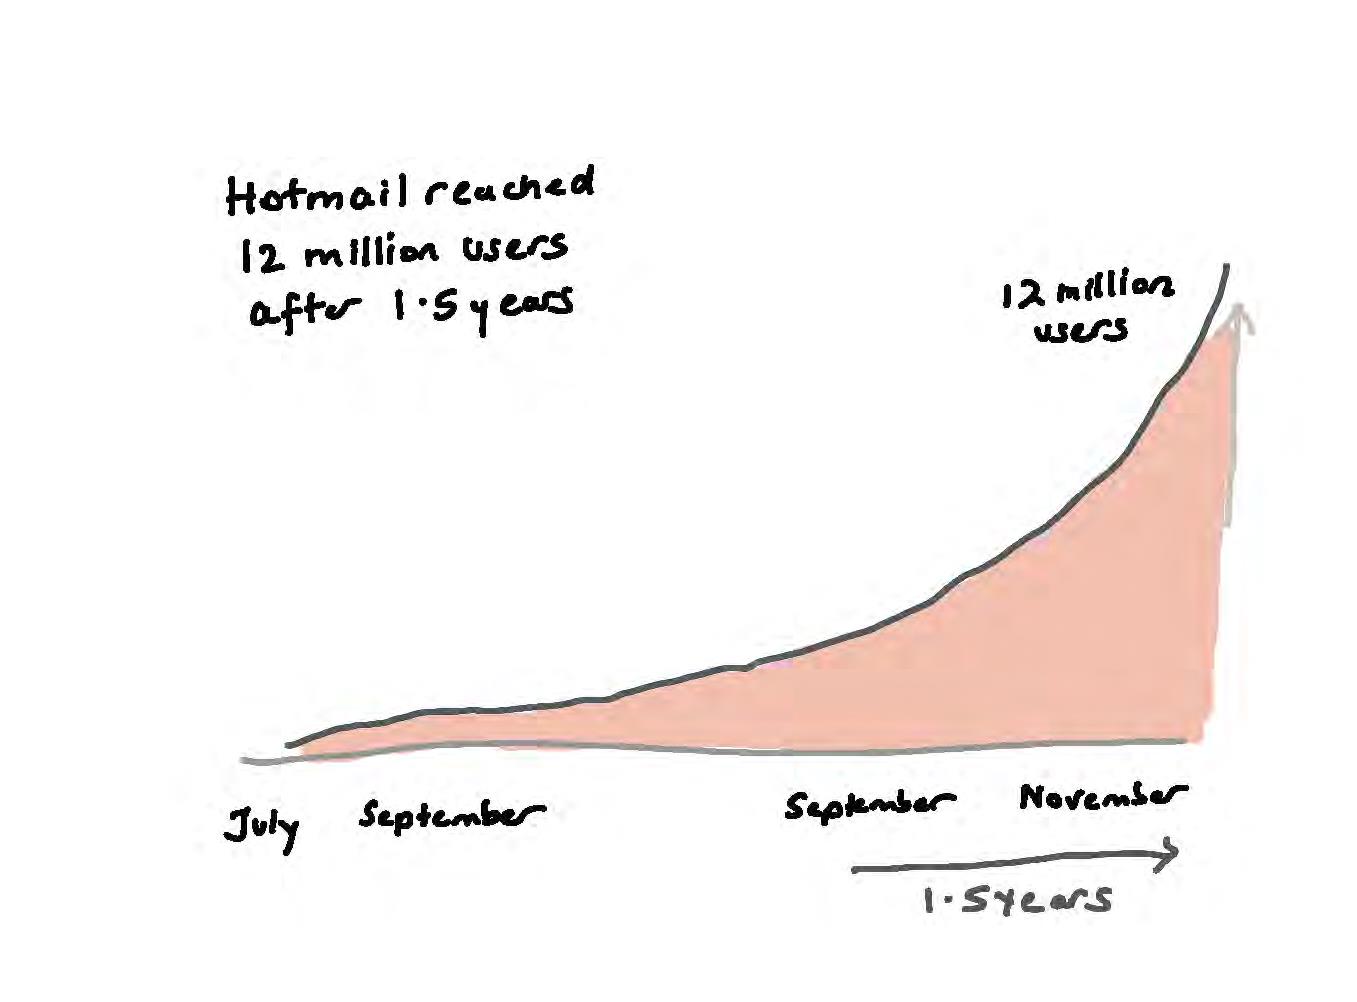
In 1996, Hotmail left a link with the message PS: I Love You. Get Your Free Email at the foot of each email, offering the recipient a free webmail account. The link kick started a J curve of growth. Six months later Hotmail hit its first million users, five weeks later Hotmail hit two million users, after 18 months Hotmail had 12 million users and sold to Microsoft. This feat was even more remarkable when you consider there were only 70 million users of the internet at this time, 1 in 6 internet users were Hotmail users.
Dropbox’s growth of 3900% through viral loops
Dropbox incentivised growth through a ‘get more space offer’ for people who referred a friend. Dropbox made this even easier for users by offering to synch the offer to all their contacts from Gmail, Yahoo etc. The growth was meteoric;
- September 2008: 100K Dropbox registered users
- December 2009: 4M Dropbox registered users
Virality is best achieved when it is designed within specific interactions within an app. With the right incentives, market timing and a great product, virality can pay extraordinary dividends. Like any other feature or campaign, virality needs to optimised through testing. Virality is a critical part of every product’s growth strategy, a by-product of design not happenstance.
References
- https://www.quora.com/What-is-a-normal-viral-coefficient-for-a-social-app
- https://viral-loops.com/blog/a-referral-booster-worth-30-growth/
- https://www.youtube.com/watch?v=raIUQP71SBU
- https://www.marketwatch.com/story/want-to-delete-facebook-read-what-happened-to-these-people-first-2018-07-27
- https://www.saxifrage.xyz/post/k-factor-benchmarks
- https://www.quora.com/What-is-the-viral-coefficient-of-successful-consumer-web-apps-like-dropbox-evernote-etc
- https://www.feeltheboot.com/blog/virality
- https://www.lbbonline.com/news/viral-loops-are-they-the-ninth-wonder-of-the-world
- https://medium.com/inside-viral-loops/how-dropbox-grew-3900-with-a-simple-referral-program-254869885316
Louise Kelly
Hearts and Minds


